Resources
Theory
- Geodesic Grid
- Geodesics on an ellipsoid
- This wiki page is explaining the various latitude & longitude based grid methods.
- stackoverflow - Mathematically producing sphere-shaped hexagonal grid
- Some basic concepts for icosahedron and geodesic polyhedra.
Software
- Applied open-source Discrete Global Grid Systems - comprehensive introduction
- Discrete Global Grid
- ELLIPSOID_GRID
dggridR
Discrete Global Grid is an open-source software that helps you to process geographical data.
It uses the Goldberg polyhedron, which includes 12 pentagons (like a soccerball). The pentagons will have 5/6 area of the hexagons. If you don’t like this, you should choose triangles or inflated squares(-> s2geometry).
In this post, I will introduce you how to use the R version of DGG.
Install R
Download R from official website.
I recommend you to install R Studio. It is IDE for R and very convenient.
Install R Packages
R is an interpreter language like Python.
But installling packages can be done within R interpreter. (Not like pip in Python)
First, open the R interpreter from terminal or R studio. If you are in terminal, you will need sudo privilege to install R packages.
$ sudo R
Resolving dependency
Let’s try to install dggridR directly.
> install.packages("dggridR")
...
ERROR: dependencies ‘classInt’, ‘s2’ are not available for package ‘sf’
* removing ‘/usr/local/lib/R/site-library/sf’
ERROR: dependency ‘sf’ is not available for package ‘dggridR’
* removing ‘/usr/local/lib/R/site-library/dggridR’
...
You don’t have to panic(yes, I did.). Just install those classInt, s2 and sf packages. And do the same thing for the future dependency errors.
> install.packages(c("classInt", "s2", "sf"))
...
If you’d like to try the official dggridR tutorials, you will also need to install those:
> install.packages(c("maps", "ggmap"))
Troubleshooting
For other errors, you can try one of those commands.
$ sudo apt install gfortran
$ sudo apt install g++
$ sudo apt install libssl-dev
$ sudo apt install libgdal-dev
$ sudo apt-get install libudunits2-dev
Official tutorial
In R ecosystem, the package developer can write dedicated introduction for the package. To view that, run:
> vignette('dggridR')
And for some errors during the tutorial, adding this line will solve the problem. (thanks to this stackoverflow page)
library(maps)
library(ggmap)
How to draw hexagonal grid
Load the package.
> library(dggridR)
You can always open manual for each package function.
> ?function
Resolution
There are 31 resolutions available. To view the information of each resolution:
> dggs <- dgconstruct(res=20) # Currently creating a random dggs object.
> dginfo(dggs)
   res            cells                area_km      spacing_km          cls_km
1    0               12 51006562.1724088639021 7053.6524314108 8199.5003701020
2    1               32 17002187.3908029571176 4072.4281300451 4678.9698717297
3    2               92  5667395.7969343187287 2351.2174771369 2691.2520709129
4    3              272  1889131.9323114394210 1357.4760433484 1551.8675487723
5    4              812   629710.6441038132180  783.7391590456  895.6018416484
6    5             2432   209903.5480346043769  452.4920144495  517.0049969031
7    6             7292    69967.8493448681256  261.2463863485  298.4793231872
8    7            21872    23322.6164482893764  150.8306714832  172.3244908961
9    8            65612     7774.2054827631255   87.0821287828   99.4910857272
10   9           196832     2591.4018275877083   50.2768904944   57.4411078487
11  10           590492      863.8006091959028   29.0273762609   33.1636203580
12  11          1771472      287.9335363986343   16.7589634981   19.1470215381
13  12          5314412       95.9778454662114    9.6757920870   11.0545373459
14  13         15943232       31.9926151554038    5.5863211660    6.3823399790
15  14         47829692       10.6642050518013    3.2252640290    3.6848456792
16  15        143489072        3.5547350172671    1.8621070553    2.1274466399
17  16        430467212        1.1849116724224    1.0750880097    1.2282818893
18  17       1291401632        0.3949705574741    0.6207023518    0.7091488792
19  18       3874204892        0.1316568524914    0.3583626699    0.4094272963
20  19      11622614672        0.0438856174971    0.2069007839    0.2363829597
21  20      34867844012        0.0146285391657    0.1194542233    0.1364757654
22  21     104603532032        0.0048761797219    0.0689669280    0.0787943199
23  22     313810596092        0.0016253932406    0.0398180744    0.0454919218
24  23     941431788272        0.0005417977469    0.0229889760    0.0262647733
25  24    2824295364812        0.0001805992490    0.0132726915    0.0151639739
26  25    8472886094432        0.0000601997497    0.0076629920    0.0087549244
27  26   25418658283292        0.0000200665832    0.0044242305    0.0050546580
28  27   76255974849872        0.0000066888611    0.0025543307    0.0029183081
29  28  228767924549612        0.0000022296204    0.0014747435    0.0016848860
30  29  686303773648832        0.0000007432068    0.0008514436    0.0009727694
31  30 2058911320946492        0.0000002477356    0.0004915812    0.0005616287
cells: total number of cellsarea_km: area of each cellspacing_km: distance between center points of neighbouring cellscls_km: characteristic length scale; diameter of a spherical cap of the same area as a cell of the specified resolution.
To get all the coordinates of cells
The cells have SEQNUM(sequential number) starting from 1.
For example, there are 1 to 12 SEQNUM where dggs have 0 resolution.
You can query the coordinates with complete set of SEQNUM values.
To query the coordinates of each vertex:
|
|
dgconstruct(res=0): Creates a dggs helper object with desired resolution; You can find other options in the manual.dgcellstogrid(dggs, 1:12): Returns a dataframe object of given sequence numbers1:12: A constructor of vector type with sequential integer numbersgrid$geometry: Column access(& assignment) operation symbol
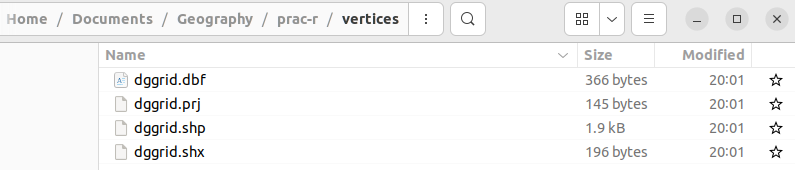
You can save dataframe into file:
> dgcellstogrid(dggs, 1:12, "PATH/vertices")
Result:
If you want center points:
> library(dggridR)
  dggs <- dgconstruct(res=0)
  dgSEQNUM_to_GEO(dggs, 1:12)
$lon_deg
 [1]   11.25000 -168.75000  -78.75000  -20.46747   42.96747  101.25000 -137.03253  -78.75000
 [9]   11.25000  101.25000  159.53253 -168.75000

$lat_deg
 [1]  5.828253e+01  5.828253e+01  3.171747e+01 -1.191726e-08 -1.762704e-09  3.171747e+01
 [7] -5.441886e-09 -3.171747e+01 -5.828253e+01 -3.171747e+01 -5.657094e-09 -5.828253e+01
For csv export:
> library(dggridR)
  dggs <- dgconstruct(res=0)
  geos <- dgSEQNUM_to_GEO(dggs, 1:12)
  write.csv(geos, "PATH/geos.csv")
Example grids
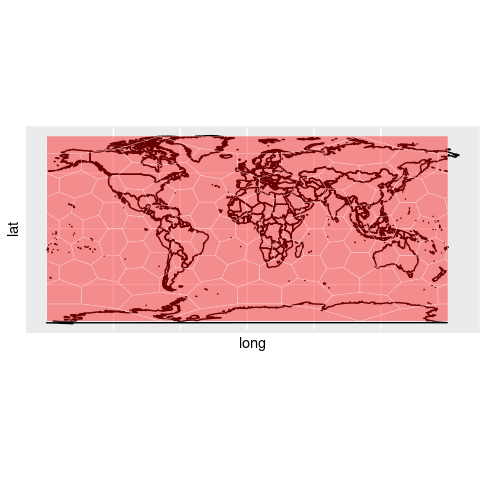 |
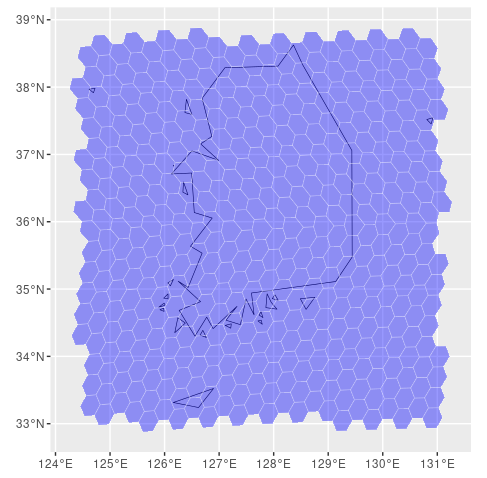 |
|---|---|
| Appearance of Resolution 2 (World) | Appearance of Resolution 10 (Korea) |
Credits
Richard Barnes and Kevin Sahr (2017). dggridR: Discrete Global Grids for R. R package version 2.0.4. “https://github.com/r-barnes/dggridR/”